An Analysis of the Effect Natural Gas Prices Have Had on Hungary's Consumption Level of Solar Energy
Adlyn Holmes
Volume I - Issue I
October 6, 2024

Explore how the Russian invasion of Ukraine has reshaped global natural gas prices and energy consumption patterns in Hungary. The economic impact of geopolitical conflicts on energy markets emphasizes the growing transition towards renewable energy sources as alternatives to fossil fuels.
1 Introduction
The Russian invasion of Ukraine in February 2022 started an exponential global gas price increase (Rowan). This price increase stemmed from supply disruptions of Russian natural gas exports and sanctions imposed by 45 countries across the globe (Piatetsky). The natural gas price increase would cause a decrease in the quantity demanded of the newly expensive Russian
natural gas, thus increasing the demand for another energy substitute, possibly a renewable energy source such as solar panels. This essay will analyze this theory by answering to what extent did the increase in natural gas futures from the Russian-Ukrainian war increase the consumption level for solar energy in Hungary from 2021 to 2023.
1.1 Justification for Chosen Topic
The conflict between Russia and Ukraine has continued intermittently since 2014. The 2022 Russian invasion of Ukraine has caused much disruption in individuals' lives, personally and economically. The main economic consequences of the war include worldwide cost-push inflation, increased natural gas prices, and thus, a possible demand shift between energy sources. I chose the topic of energy substitutes and the natural gas price increase due to its worldwide relevance and lingering economic aspect.
Personally, my father worked in Ukraine during the first year of the war as a member of the U.S. State Department. The job he had in Kyiv was exhausting and demanding. I often struggled to contact him due to his work. He was relieved when switching stations to Budapest, surrounded by less life-threatening circumstances. However, the impacts of war are not withdrawn when leaving the country. The lingering economic aspect of this war is the topic I chose due to its personal significance.
The timeline of 2021 to 2023 is chosen to properly compare the price and consumption-related statistics from the year before and after the start of the war. Years before 2021 are not selected due to possible COVID-19 alterations in consumption and price levels. It is essential to acknowledge that “consumption level” and “quantity demanded” are not the same ("Consumption vs. Demand"). Consumption refers to an amount of a good or service in use, whereas quantity demanded is several goods or services a consumer is willing and able to buy at a given price (“What is ‘Quantity’”).
Fundamentally, consumption is the direct action and usage of demand (Carroll). For this paper, "consumption" refers to the amount of solar power generated in Hungary and will be measured rather than "quantity demanded" due to its feasibility of being measured accurately. Despite the difference between consumption and quantity demanded, the determinants of demand will still be examined as demand represents the scope of consumption. This explanation is included to justify the terms in the research question.
1.2 Methodology
The limitations in finding specific statistics were evident throughout the research. My methodology was to align the timelines of natural gas price fluctuations with the solar and natural gas generation levels. However, I needed help finding credible sources for these statistics. Therefore, I interviewed two economists who work for the U.S. embassy in Budapest. They assisted with providing reliable sources regarding natural gas price information and consumption/generation levels for different energy sources. They suggested MAVIR, a Hungarian energy company, for consumption statistics and the Dutch TTF for natural gas prices. Additionally, ENTSO-E is used for solar and natural gas electricity generation.
The economist interview questions are a series of general to specific queries covering the economic causes and effects of the war on Hungary, as seen in Appendix A. The Oxford IB Economics textbook will be primarily referred to for definitions and explanations of economic theories.
1.3 Hypothesis
Based on demand determinants and the price of related substitute goods, I believe that as natural gas prices grow, Hungary will shift towards alternative energy sources. This shift will likely lead to increased consumption of alternative energy sources in Hungary, such as solar power, as the rising price of natural gas promotes the adoption of more cost-effective energy substitutes.
2 Context
2.1 Russian-Ukrainian War
The conflict between Russia and Ukraine began in February 2014 when disguised Russian troops invaded the Ukrainian Republic of Crimea. The conflict expanded in April when Russian troops annexed Ukraine's Donbas region, where Ukraine gained the province back from Russian control. The two countries faced a stalemate until February 2022, when Russia launched a full-scale invasion of Ukraine titled “Special military operations” by Russian President Vladimir Putin (Ray). The attack disrupted all of Europe. Many European countries swiftly imposed sanctions on Russia’s gas and oil exports, attempting to limit Russia’s funding for the war (Trade Oil). Natural gas rapidly increased in price due to sanctions, failed attempts at price caps, and supply-shock factors. The uncertainty in gas exports and supply contributed to an increase in gas prices. The background of the ongoing Russian-Ukrainian war is critical to include in this paper because it provides context for why the price of natural gas increased.
2.2 Supply determinants
Supply determinants are examined to provide possible explanations for the rise in natural gas prices. 2.2.1 Technological Change Leaks were found in the Russian natural gas pipelines under the Baltic Sea, Nord Stream 1 and 2, in September 2022 (Picheta). Each Pipeline has two pipes, and only one pipe in Nord Stream 2 remained intact. However, Nord Stream 1 was not previously used due to the rising political tensions (Soldatkin et al.).
These leaks are categorized as technological setbacks, falling under the supply determinant of technological change. A technological change is a non-price determinant that directly relates to the change in the supply of a product: If technology advances, so will supply (Blink and Dorton 84). The technological lapse of the pipe leaks would cause disruptions in supply and an increased price. Due to the pipe damage, the gas supply fell in countries still consuming Russian natural gas. This causes the supply curve to shift leftward, increasing the price and decreasing the quantity demanded.
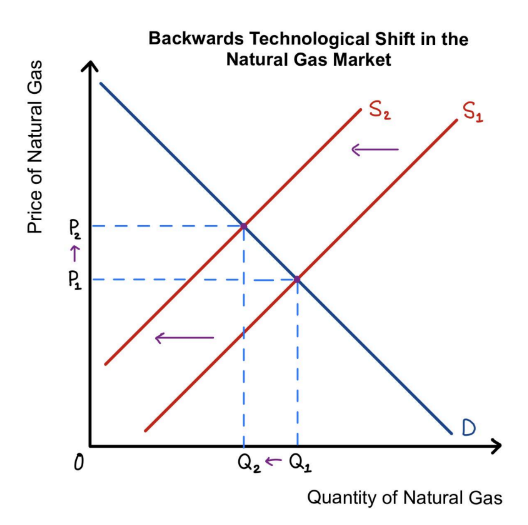
Figure 2.1: Example of a backward technological shift in the natural gas market (adapted from Blink and Dorton 84). Overall, the price of natural gas increased, and the supply decreased. The increased price reduces the quantity demanded of the product, as higher prices would decrease the quantity demanded of natural gas. 2.2.2 Supply shortage A supply shortage signifies that the quantity demanded for a product is higher than the rate at which the product can be produced, leading to excess demand (Blink and Dorton 99).
The supply shortage is “being driven by [Europe’s] reliance on energy from Russia, which has slashed natural gas flows to Europe in response to Western sanctions'' (Egan). Recent sanctions, failed price caps, and the Nord Stream pipeline leaks have cut off the largest exporter of natural gas in Europe, leading to excess demand (“Russia Country”). 6 Figure 2.2: Example of a supply shortage in the natural gas market (adapted from Dorton and Blink 99).
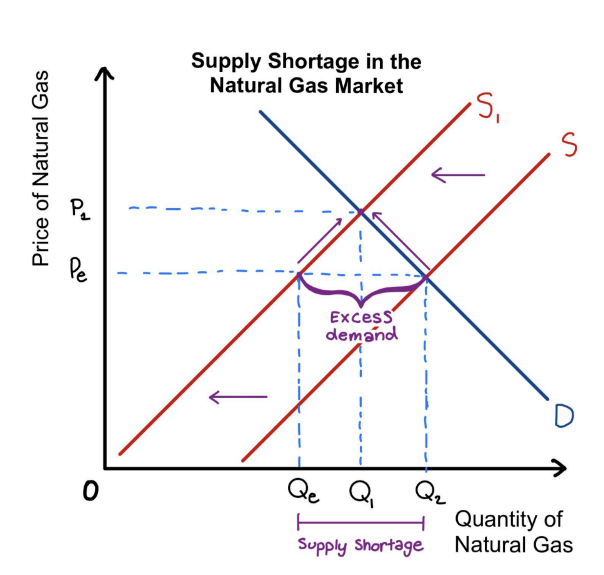
Figure 2.2 depicts a supply shortage. The supply curve shifts leftward, causing excess demand. Excess demand forces firms to raise the price of their products, causing a movement along the second supply curve and, therefore, causing a price increase from Pe to P1 . This decreases the quantity demanded from Q2 to Q1 and increases the quantity supplied from Qe to Q1 for the product, thus lessening the excess demand.
2.3 Demand Determinant
2.3.1 Price of related goods
Out of the six non-price demand determinants, the fitting determinant for solar energy’s demand shift is the price of related goods: substitutes. Only non-price determinants are 7 considered when examining a demand shift in solar panels because the demand change for solar panels would be caused by the price change of natural gas rather than its own price.
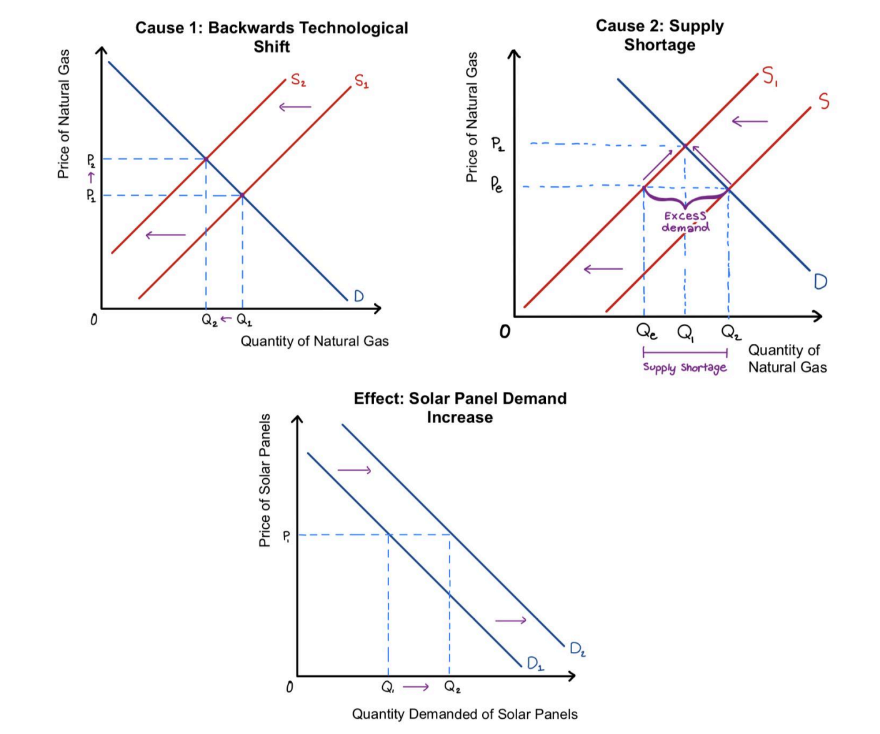
Figure 2.3: Example of demand determinant, “Price of related goods” between the natural gas market and solar panel demand, with two possible causes for price increase in natural gas. This determinant uses the relationship between two goods or services within the same category. When one good’s price rises, its quantity demanded will fall. Consumers will desire a replacement for the newly expensive good and, therefore, demand a related good. The result is a 8 decreased quantity demand for the first commodity and a rise in demand for the second good or the substitute (Blink and Dorton 47-48).
Figure 2.3 depicts two possible causes for natural gas prices to increase and the effect the price rise would have on the demand for solar panels. The rise of natural gas prices would cause a demand shift to cheaper, alternative energy sources, such as solar energy. The substitute for natural gas electricity generation would be solar electricity generation. Evaluating the demand determinant of substitutes is crucial because it is the theory behind the research question and will be referenced in this paper.
2.4 Dutch TTF
The Dutch Title Transfer Facility (TTF) is a natural gas exchange center in the Netherlands. It acts as a platform for countries to trade gas with each other ("Gas Exchanges''). The pricing of the TTF natural gas futures serves as a benchmark price for natural gas throughout Europe (Natural Gas Intelligence (NGI)). Senior government officials, including Hungarian Prime Minister Victor Orban, have confirmed that Hungary’s gas contract, which acts as a price-setting factor, is linked to the Dutch TTF gas price benchmark (Gaal and Moo). Hungary gets around 80% of its natural gas from Gazprom, Russia’s main gas and oil company (Reuters). However, due to difficulties in finding publicly available information on Gazprom's prices, the benchmark price set by the Dutch TTF will be analyzed as a substitute.
The information regarding the Dutch TTF company is crucial, as it provides information on European benchmark prices and explains why direct Gazprom prices are not included or used in this paper. 9 2.5 2030 Climate Target Plan The EU’s 2030 Climate Target Plan is in line with the EU Green Deal that aims “on reducing greenhouse gas emissions to at least 55% below 1990 levels by 2030” (“2030 Climate”). The Climate Target Plan aims to help avoid the severe impacts of climate change and strives to achieve climate neutrality by 2050. Hungary is involved in the EU’s Climate Target Plan. The green transition shows that Hungary is already committed to decreasing its carbon footprint, therefore proving that there is more than one motivating factor for a possible demand shift to solar energy.
3 Natural Gas
3.1 Measuring Price
3.1.1 Raw prices
Increases in gas prices will lead to a fall in quantity demand for natural gas. The price rise would also lead to a shift in demand from natural gas to alternative, cheaper energy substitutes. Therefore, natural gas prices must be examined first before determining if solar panel demand increased.
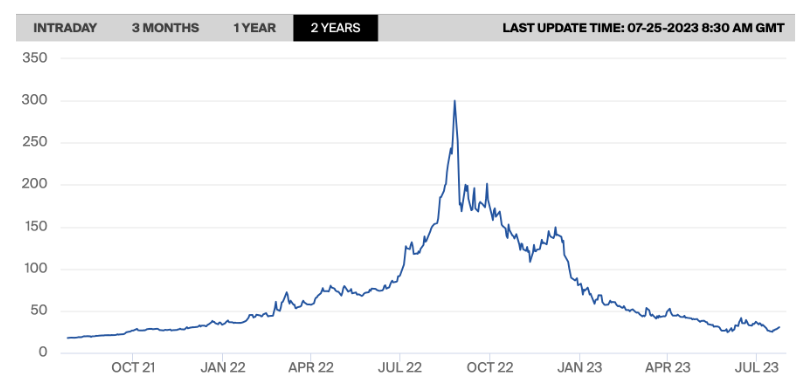
Figure 3.1 depicts the Dutch TTF futures from July 2021 to July 2023. Gas futures are a type of exchange-traded contract in which the buyer commits to acquiring a specified quantity of natural gas from the seller at a predetermined price on a future date (“Natural Gas Futures"). The graph displays the price on the y-axis in Euros and Euro cents per MWh and the date on the x-axis. MWh is an electrical measure of output equal to 1,000 kilowatts of electricity produced per hour ("Megawatt Hour"). 10 Figure 3.1 ("Dutch TTF Natural Gas Futures") The first spike in gas futures was in February 2022, when Russia invaded Ukraine. Afterward, the price increase continues, first steadily, then exponentially, until August 2022.
This spike could represent the supply shortages and technological setbacks related to natural gas. From August 2022, the price generally drops until December 2022, when it narrowly increases. Afterward, the price falls steadily until July 2023, when the gas futures information ends.
3.1.2 Calculating Average Prices
To measure the price fluctuations in Figure 3.1, I created a table with the average price per month and price change per month in Figure 3.2.
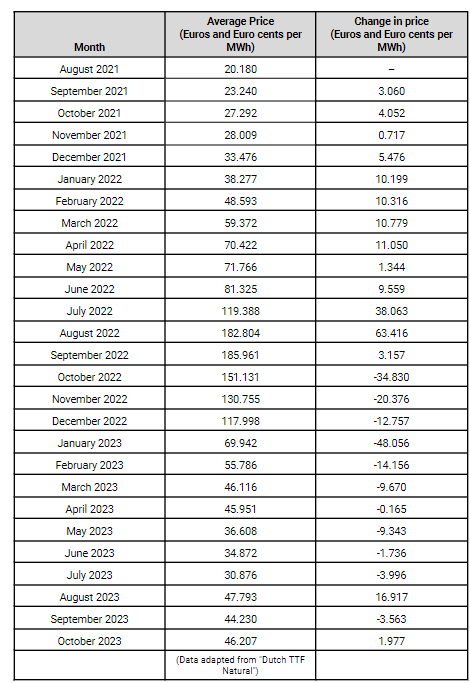
Figure 3.2: Calculating average monthly price and price difference of Dutch TTF futures The monthly average price was calculated by taking the mean of five prices throughout each month. The specific dates and data used for each monthly average can be seen in Appendix B, C, and D. The price change was calculated by subtracting the previous month’s price from the next month’s price.
3.1.3 Calculating Real Prices
To accurately measure the price change, the statistics must be adjusted for inflation. Figure 3.3 displays the nominal and real price of the natural gas futures I calculated using the Dutch CPI (Consumer Price Index). The consumer price index is an index used to calculate inflation by measuring the price change from a chosen basket of goods, including natural gas, within the economy (Blink and Dorton 294-295, Desilver).
The extent to which the prices fluctuate determines the inflation rate. CPI is often difficult to calculate and comes with a time lag; thus, there is no data for September and October 2023 (Blink and Dorton 297). The Dutch CPI is used to calculate the real prices because the TTF is stationed in the Netherlands so the gas should follow the same inflation rate.
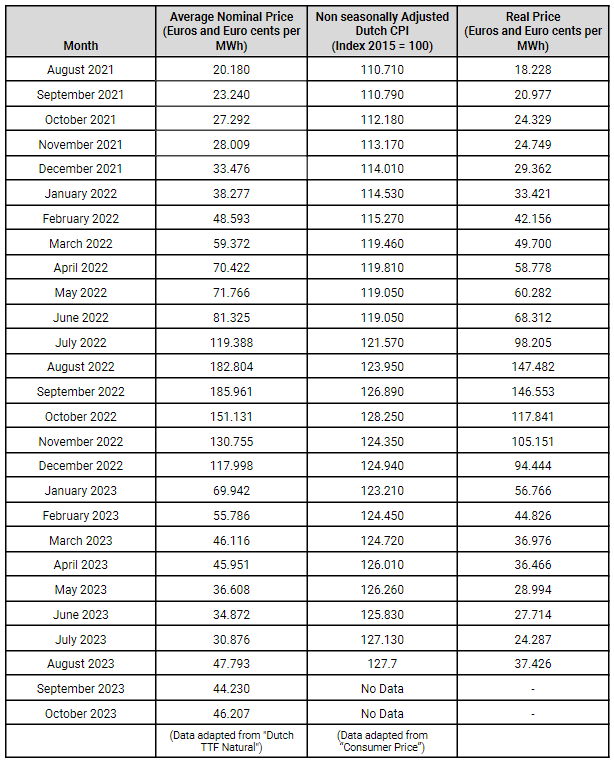
Figure 3.3: Calculated real Dutch TTF natural gas futures with the included Dutch CPI The real price was calculated using the following formula:
("Deflating Nominal") 14
3.1.4 Analyzing prices
Figure 3.4 shows the summary of the Dutch TTF natural gas futures. The table includes the nominal and real price and price change of every month. The real price change was calculated by first finding the real price and then subtracting the previous month’s real future from the next month’s.
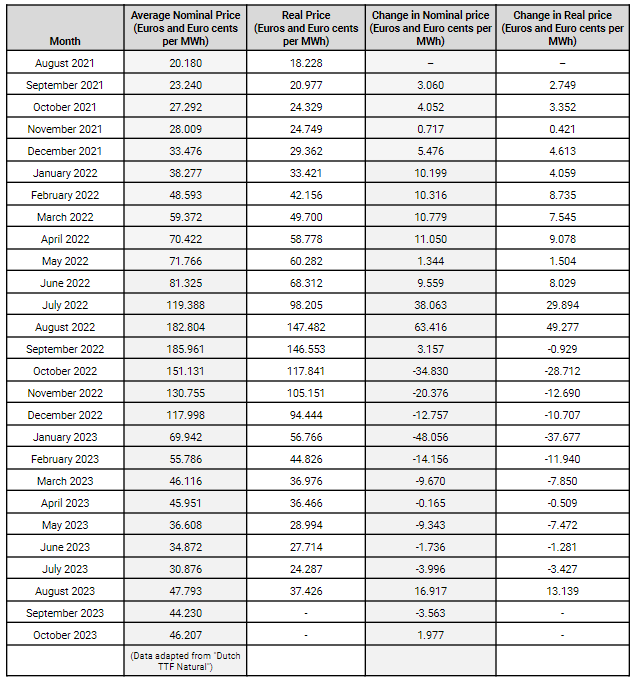
Figure 3.4: Summary, including average real, nominal, real change, and nominal change in natural gas prices. 15 Overall, the real prices of the natural gas futures show a steady increase until February 2022, when the first price spike was witnessed and caused by the Russian invasion. After February 2022, the prices rapidly increased until the peak in September 2022, when the prices fell until April 2023. After September 2023, there is no more data available on the real prices due to a lack of CPI.
4 Solar Energy
4.2 Measuring Consumption
The consumption of different energy sources is examined and included to prove that there was a change in solar and natural gas consumption levels. After measuring consumption, the generation levels of natural gas and solar energy can be compared against the gas futures to determine if the gas futures caused a solar energy demand shift.
4.2.1 Yearly Consumption Level Ratio
The following data is provided by a Hungarian Electricity Transmission System Operator called MAVIR. MAVIR supervises the Hungarian electricity system by ensuring all assets are modern and accurate. MAVIR also works with neighboring countries by overseeing the operation of the Hungarian electricity system with nearby networks while offering assistance and ideas for possible grid development (Navitasoft).
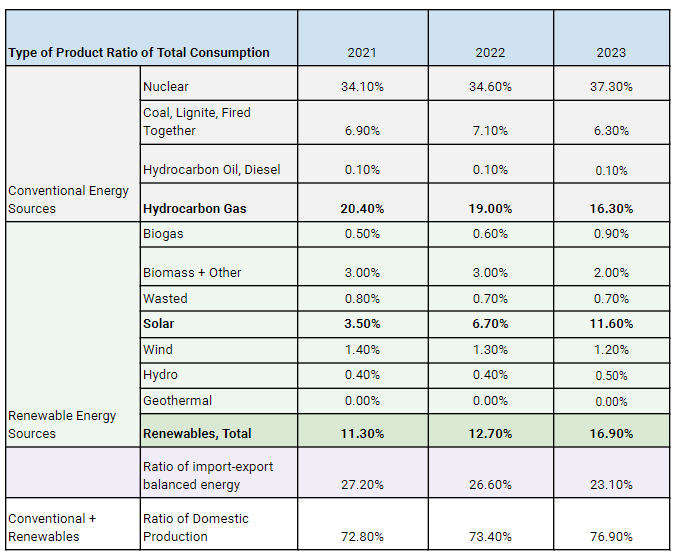
Figure 4.6 displays the consumption level of different energy types consumed in Hungary from 2021 to 2023. It is included to demonstrate that solar energy and hydrocarbon gas are the only energy sources in Hungary whose consumption has significantly changed from 2021 to 2023.
Figure 4.6: Ratio of energy in the total consumption from January 2021 to June 2023, (adapted from MAVIR Type of Product)
Figure 4.6 proves that alterations in consumption levels within the Hungarian energy market are primarily caused by the changes in consumption of natural gas and solar energy. Hydrocarbon gas and solar are the only energy sources that have changed drastically from 2021 to 2023. This confirms that the high natural gas prices would have only changed the demand for solar energy, as no other energy source’s consumption is altered as drastically.
Figure 4.7 summarizes the data collected from Figure 4.6 by displaying the consumption relationship between solar energy and natural gas from 2021 to 2023.

Hydrocarbon gas consumption in Hungary decreased from 2021 to 2023 by a total difference of 5.2%.
Alternatively, solar power consumption increased by 8.1% within the same time period. This confirms a transfer in consumption levels between solar energy and natural gas. The monthly energy consumption/generation rate must now be compared against the monthly gas futures to demonstrate that higher natural gas prices caused this energy exchange.
4.2.2 Monthly generation level
The following data is collected from the European Network of Transmission System Operators for Electricity (ENTSO-e), which unites members from the European transmission system operators (TSO), ensuring the secure and coordinated operations of Europe's expansive electrical grid ("ENTSO-E Mission"). ENTSO-e and MAVIR are partners that trade and share information with one another. ENSTO-e has publicly available data on daily “Actual aggregated Net generation output (MW) per market time unit and per production type,” however, it does not have monthly values ("Actual Generation, [16.1.B&C]").
Therefore, I calculated the monthly average generation level to compare against the oil prices. It would be meaningless to calculate the daily average generation level within every month for three years. So, to save time and energy, I calculated the monthly average generation level by finding the average solar and gas output at noon for five 18 days, one week apart, from each month. The specific dates and data found for each day are in Appendix E, F, and G. Although the generation level differs from the previously measured consumption level, it displays the actual energy generated, which directly affects consumption. Power must be generated first to consume it, so measuring the generation levels will be a fair measurement of energy consumption.
Monthly average energy generation levels between natural gas and solar energy from 2021 to 2023 (adapted from “Actual Generation”)
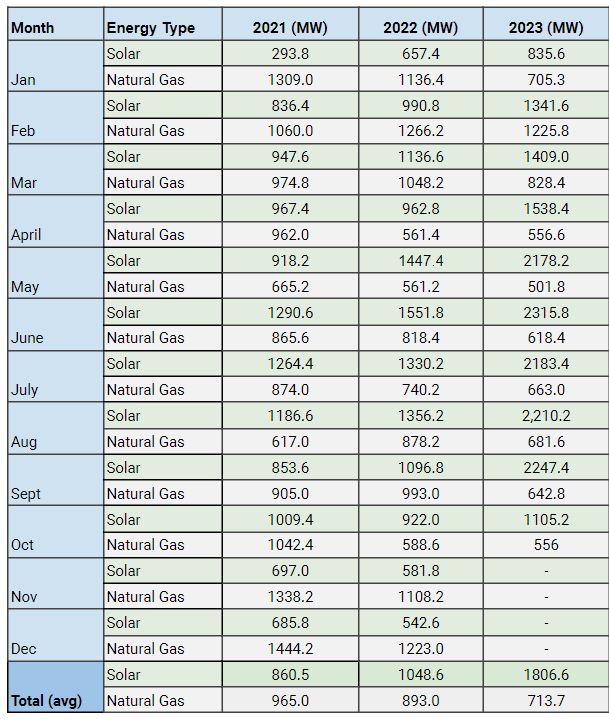
Figure 4.8 displays the calculated monthly average solar and natural gas generation levels. Generally, there is a trend of higher gas generation during wintertime and higher solar generation during summertime. However, this becomes less significant during 2023, when solar power is predominantly generated compared to natural gas. In 2021, the gas-to-solar generation trades off between winter and summer, with higher natural gas generation overall. In Hungary 2022, disregarding January, the gas-to-solar ratio is almost one-to-one (with an approximate margin of 150 MW) until April, when the ratio becomes almost one-to-two.
In May, the ratio becomes one-to-three, with solar energy power generation almost reaching its 2022 peak. Starting in October 2023, the natural gas reliance stays above solar generation. Every month in 2023 has a higher solar power generation than natural gas, with the ratio starting at one-to-one in January and reaching almost one-to-four in July. The yearly average generation level for solar and natural gas changes; solar generation doubles, while natural gas generation decreases by roughly 20%.
Analysis 5.1 Comparing data
To determine the extent to which the rise in natural gas prices caused the increase in solar power consumption, all of the collected data should be compared. Figure 5.1 includes the solar and natural gas generation levels and the real natural gas futures collected from the Dutch TTF. The generation levels are measured in MWs, while the gas futures are calculated in Euros and Euro cents per MWh.
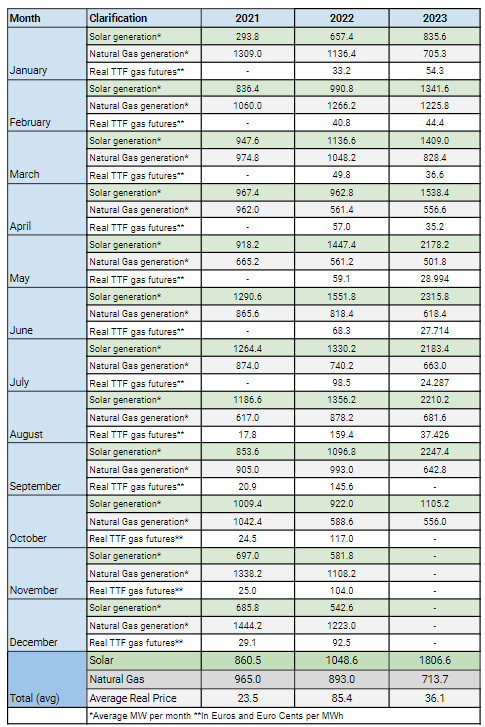
Figure 5.1: Monthly average energy usage between natural gas and solar generation and real Dutch TTF futures from 2021 to 2023 (data adapted from “Actual Generation” and “Dutch TTF Natural”) 21 The data shows a prominent increase in solar electricity generation than natural gas electricity generation, beginning in January 2023. From there, solar energy generation increases rapidly. This solar energy generation increase is a four-month lag from the natural gas future peak in September 2022. During the three months between September and January, gas futures steadily increased, and solar generation fell by 554.2 MW. During the same time, natural gas output rose by 230 MW.
This decrease in solar power could be caused by seasonal changes due to less daylight during winter, causing an increase in gas generation to substitute the fall in solar output. A solar panel supply shortage is the primary justification for the four-month delay between the gas future peak and the generation increase. A supply shortage would be caused by a swift increase in demand for solar energy. The demand would rise faster than the supply, driving excess demand. This demand rise could be due to anxious consumers wishing to seek cheaper, alternative energy sources to avoid paying high heating prices from natural gas. Another explanation for the four-month delay is that solar panel supply could have a relatively inelastic price elasticity of supply (PES), meaning that a price rise would cause a proportionately smaller increase in quantity supplied (Blink and Dorton 92-95).
A relatively inelastic supply would result from the limited installed capacity or funding related to installed capacity. The PES could become more elastic with increased installed capacity and installation of factories over time, resulting in lower excess demand and higher solar electricity generation output. 6 Conclusion The publicly available data does not establish a direct causation between rising hydrocarbon gas futures and increased solar energy generation, making it difficult to confidently conclude that the price of natural gas increased the solar consumption level.
An intervening 22 variable in this relationship is the four-month lag between the peak in natural gas futures and the rise in solar energy generation. The length of the delay can be justified when considering a potential solar panel supply shortage, the PES of solar panels, and the natural flow of demand throughout the economy. These factors have been previously discussed and explained. Therefore, to answer the research question, “To what extent did the increase in natural gas futures from the Russian-Ukrainian war increase the consumption level for solar energy in Hungary from 2021 to 2023?” It can be concluded that natural gas futures increased the consumption level for solar energy in Hungary from 2021 to 2023 to a relatively moderate extent. Certainly, the natural gas futures accelerated solar energy consumption but were not the main factor causing it.
Evaluation 7.1
Limitations 7.1.1 Seasonal and weather factors
Solar panels function by absorbing sunlight by the PV cells within the panel and storing unused energy in a battery or through a grid (“Solar Energy”). Thus, PV units cannot actively function or generate electricity without sunlight or batteries. That is why the monthly generation level would be significantly affected by constant cloudy weather or less daylight, altering the capacity for energy generation. Solar generation is considerably lower throughout the wintertime when there are fewer daylight hours. Alternatively, natural gas generation is not limited by the weather or seasons, allowing for an adaptational use over solar panels.
However, natural gas is needed less throughout the summertime as it is primarily used as a heating element for buildings and households. Additionally, the monthly average temperature could vary, altering the requirement for heating in buildings. Weather and seasonal alterations cause many limitations and altering factors to energy usage and generation.
7.1.2 EU’s Climate Target Plan
The EU green transition is the most significant limiting factor. The green transition illustrates Hungary’s commitment to adopting more sustainable energy sources. Thus, the rise in natural gas futures may have accelerated solar consumption but was not the main factor. The Green Deal causes difficulties in confidently concluding that solely natural gas prices increased solar consumption. 7.1.3 Time measurement 2023 has not yet ended, allowing for possible future fluctuations in generation level, altering the answer to the research question. The average yearly data collected is incomplete due to the lack of data for 2023 and a lack of natural gas futures from 2021. This causes limitations in comparing and analyzing data.
7.1.4 General Errors
It is important to acknowledge general errors in statistical analysis throughout the research. Inaccurate translations from Hungarian to English could cause errors in decoding and understanding the intended messages from Hungarian sources. The natural gas prices that the Hungarian government pays are unknown due to unpublished Russian Gazprom data. General inaccuracies could be found within the solar generation data measurement due to households independently installing solar panels, acting as a form of hidden GDP. Uncertainties about the 24 direct cause of solar energy generation increase is a large limitation as causation is complicated to measure without explicitness.